Gaps Analysis
Last modified:
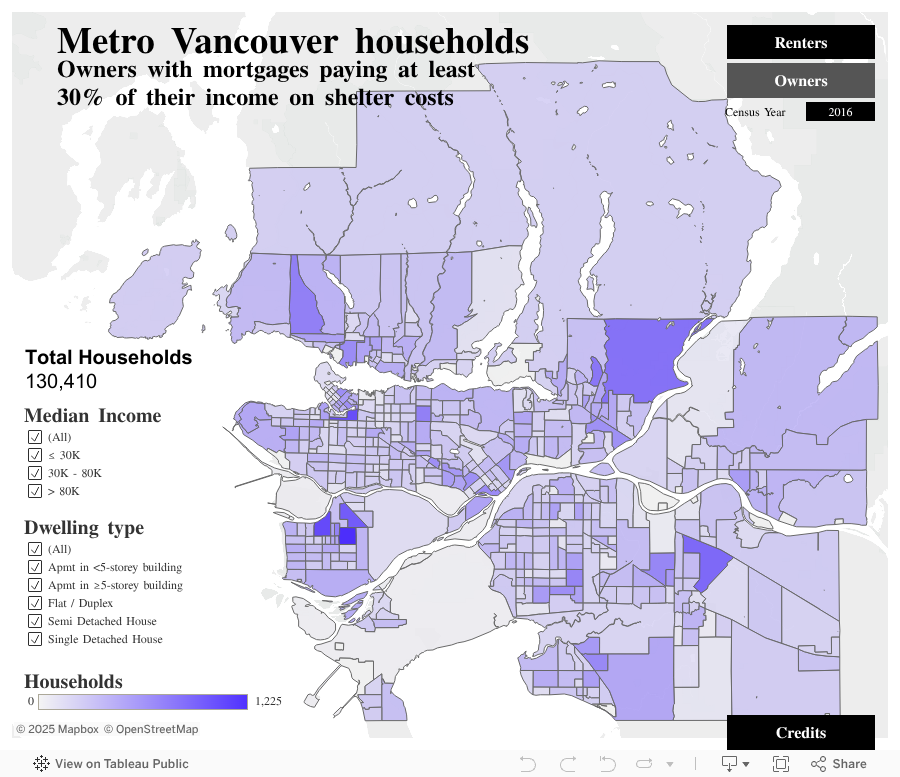
This project provides interactive visualizations to map housing affordability pressures across the three Census Metropolitan Areas (CMAs) of Metro Vancouver, Montreal, and Toronto. Using 2016 Census data, the project identifies where households are spending at least 30% of their income on shelter costs, highlighting spatial concentrations of housing cost burden across the three CMAs.
Where are housing affordability pressures most concentrated across Metro Vancouver, Montreal, and Toronto?
The project’s visualizations allow users to explore the distribution of households paying at least 30% of their income on shelter costs. Each visualization covers one of the three CMAs and is divided between renters and owners with mortgages, with filters for dwelling type and median income group.
Project Lead(s):
Home Organization:
University of British Columbia
Other Participants:
Andrés Peñaloza
Community Partner:
BCNPHA
Funding Stream:
Comparative Project
Project Status:
Completed
Background
Housing affordability pressures are not evenly distributed across CMAs, and there is a need to better understand where households are experiencing higher shelter cost burdens. This project aimed to identify and visualize where households are spending at least 30% of their income on shelter costs, in order to highlight areas where housing need is most acute.
Methodology
The project used data from a custom Statistics Canada 2016 Census order. Renters and owners with mortgages in each CMA were cross-tabulated by geography (census tract and CMA) against shelter cost to income ratio (30% to <50%, ≥50%), shelter cost, structural type of dwelling, and median total income of households (2015), producing 70 unique columns of median incomes for each CMA and census tract. Statistics Canada suppresses data for small sub-populations; where median income was suppressed at the census tract scale, it was imputed to match the CMA figure. Individual households within each of the three median income groups may therefore have actual incomes that fall into a different income category, and should be interpreted as belonging to a sub-population whose median income falls into one of the three groups.
Results
The project’s visualizations highlight neighbourhoods where high housing cost burdens are concentrated, making it easier to see where renters and owners are under the most pressure. They also show how affordability challenges differ by tenure, dwelling type, and income group within each CMA.
Toronto
Montreal
Vancouver